Comparative Model Analysis
Comparison
Approach
The initial approach was to perform ETL on the heart disease data set and split the data using SciKit-Learn into a single train and test data set. This split data was then saved to csv files for each model architecture to be built and optimized. Only one version of the split train data was used to optimized the parameters of the models. By holding the train and test data split constant, it was believed that comparison of the five models would be more equivalent.
After reviewing false predictions across several models, it was observed that the majority of the false predictions were the same. Thinking through the results, it made sense that some samples may be harder to classify (potentially based on the train data) and therefore multiple models would falsely label the same data points. Based on this observation, to help understand the general performance of the different models, the team decided to split the full data set over multiple iterations and calculate the precision and accuracy of the models against different samplings of the test data.
Finally, the team decided to create two voting models. The first was a majority vote where if three or more models predicted heart disease then the “majority prediction” would vote heart disease. Otherwise, it would be given an output of healthy. The second model was a conservative model based on the desire to overpredict heart disease rather than underpredict it. This model predicted heart disease if a single model predicted it otherwise it requires a unanimous vote to predict healthy.
Models
- Random Forest (RF)
- Logistic Regression (LR)
- Support Vector Machines (SVM)
- K Nearest Neighbor (KNN)
- Neural Network (NN)
- Majority Vote (Majority)
- Conservative Vote (Conservative)
Metrics
SciKit-Learn model score – obtained from each model
Confusion Matrix– Our goal was to minimize False Negatives.

Accuracy
How often were samples classified correctly?
(TP + TN) / N
Precision
Of all the samples classified as Heart Disease, how many are heart disease? TP / (TP + FP)
Recall
Of all the actual heart disease samples, how many were classified as heart disease? TP / (TP + FN)
F1 Score
Harmonic average of precision and recall where 1 is perfect and 0 is worst. 2 * ((Precision * Recall)/(Precision + Recall))
Data was split a number of times to generate a population of the metrics above to understand the general accuracy and precision of each models.
Comparisons
For each metric above:
- A one-way ANOVA was applied to look for statistical significance in the means of the confusion matrix metrics between the different models.
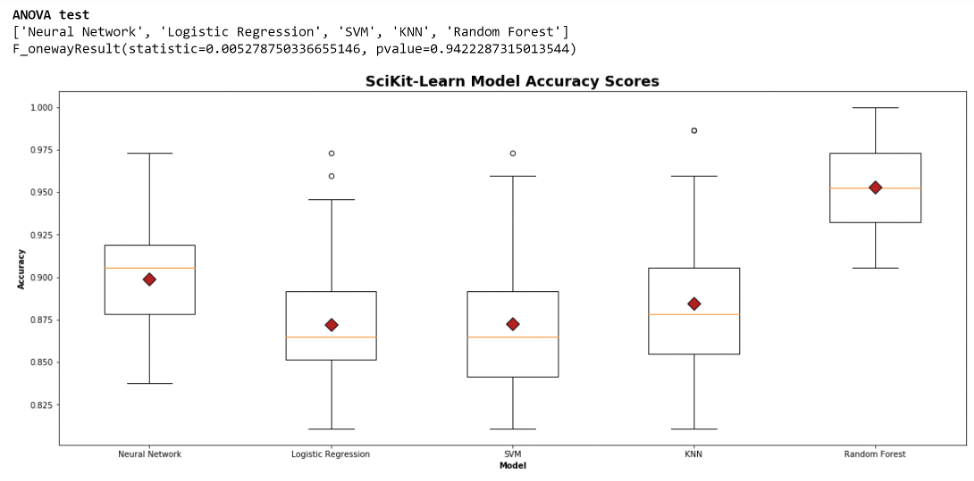
- A box-whisker plot was created to visualize population of the metrics for each mode.
Observations
- Running minimal iterations (such as 5) of the split test data did not always show a difference between models for each metric. However, increasing the number of iterations (like to 500) increased the confidence and often demonstrated statistical differences between the models. Ultimately, the final number of iterations used for the analysis was 50, because it showed statistical difference between the models without repeating similar splits between the test data.
- The SciKit-Learn model scores show Random Forest has the highest accuracy with Neural Network coming in second. However, when reviewing the confusion matrix metrics, we observed the following:
- Highest Accuracy – Neural Network
- Highest Precision – Random Forest then Neural Network 2nd
- Highest Recall – Conservative Vote then Neural Network 2nd
- Highest F1 Score – Neural Network
Conclusions
Random Forest was the most precise at predicting heart disease, but also underpredicted it overall (see Recall results). Because we prefer to over predict heart disease to ensure no sick patients go undiagnosed, we held a bias toward recall in our selection. The Conservative Vote, as expected, outperformed all models in Recall, but otherwise did not. The Neural Network outperformed or was a close second in all metrics.
ANOVA & Histogram Samples
50 Iterations


